High-Volume Logs Without Indexing Yourself Into a Corner
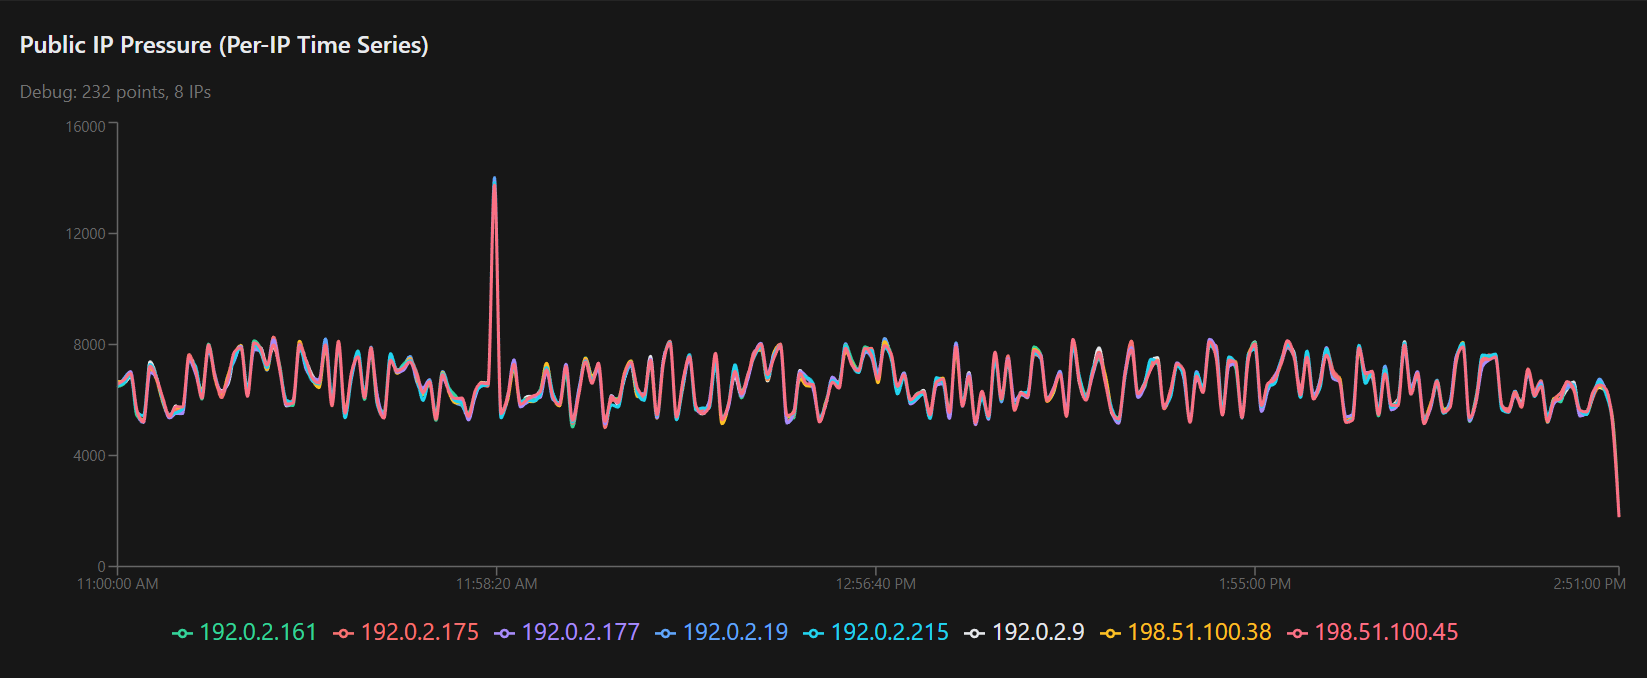
Link To the Live Dashboard shown above: https://dangerousmetrics.com/exp-hvl-logs, click the CGNAT Example link.
A CGNAT Case Study in Aggregation-First Design
Carrier-Grade NAT logs are a perfect example of a class of data that breaks naïve logging architectures.
They are extremely high volume, structurally repetitive, rarely searched line by line, and operationally important almost entirely for trends, pressure, and anomaly detection rather than individual events. Treating them like application logs and indexing every line into a search engine is an expensive mistake that many systems eventually regret.
This post walks through a concrete CGNAT example, using real-scale data volumes, to show a different approach: keep raw logs compressed and cheap, derive the facts you actually need, and index only those facts.
CGNAT is the example here, but it is not unique. This pattern applies equally well to NetFlow, IPFIX, SIP logs, firewall connection logs, email transaction logs, and similar high-volume infrastructure data.
The Starting Point: Realistic Volume
To reason about scale, you need real numbers. For this experiment, CGNAT session creation logs were generated at production-like rates to give the system something meaningful to chew on.
Over a four-hour window, the dataset looked like this:
-
Approximately 58 GB of raw plain-text CGNAT logs
-
Millions of individual session creation events
-
Log lines with timestamps, subscriber IPs, public NAT IPs, ports, and protocol
The logs were simulated, not captured from production, but the format, cardinality, and volume were intentionally chosen to match what real CGNAT systems produce. Simulation here is not about correctness of individual flows. It is about stress, scale, and behavior under load.
Once generated, those logs were compressed with zstd:
-
Raw: ~58 GB
-
Compressed: ~12 GB
That compression ratio alone is already an important data point. These logs are highly structured and compress extremely well. Keeping them raw but compressed is cheap.
The Key Observation
Out of tens of gigabytes of logs, what operators actually want to know, minute by minute, is surprisingly small:
-
How many sessions are being created
-
How many unique subscribers are active
-
Whether public NAT IPs are balanced or drifting
-
Whether pressure is rising, falling, or spiking
-
Who the current top talkers are
All of that can be expressed in one document per minute.
That means:
-
60 documents per hour
-
1,440 documents per day
Not millions. Not billions.
Aggregation First, Search Second
The system is intentionally split into two distinct paths:
-
Raw logs as compressed files on disk
-
Derived, minute-level summaries indexed into OpenSearch
The raw logs remain the authoritative source. They are sliced by time on disk, compressed, and cheap to retain. They are only touched when deep forensics are required.
The derived summaries are what power dashboards, trending, and alerting. These are the facts operators consume every day.
This separation is the core design choice.
How the Aggregator Works
The aggregator is written in Go and operates in strictly bounded time slices. Each minute of logs is processed independently. There is no global state and no cross-minute dependency.
Conceptually, the workflow is:
-
Read one minute of compressed CGNAT logs sequentially
-
Parse only the fields required for aggregation
-
Update in-memory counters and maps
-
Emit a single derived document for that minute
-
Move on to the next minute
Because each minute is independent, the work is embarrassingly parallel. On modest hardware, four hours of logs were processed in about four minutes using two CPU cores. On a larger system, this would complete in seconds.
This is what “scales with cores” actually looks like.
What the Derived Documents Contain
Each per-minute document stored in OpenSearch looks roughly like this:
That single document summarizes millions of raw events.
Importantly, fields like top_subscribers are intentionally lossy. They capture ranked snapshots, not full time series. This is a deliberate tradeoff to keep storage and query costs low.
Why the Logs Were Simulated
The logs were generated rather than captured from production for one reason: volume.
It is difficult and often inappropriate to extract tens of gigabytes of CGNAT logs from a live network just to test an architectural idea. Simulation allows full control over volume, time range, and behavior without operational risk.
What matters here is not whether subscriber 10.64.5.40 really talked to a specific destination. What matters is whether the system behaves correctly under realistic load and whether the derived metrics make sense.
They do.
The Go Generator and Time Slicing
The log generator itself is also written in Go and mirrors how the aggregator expects data to be laid out.
Key design choices:
-
Logs are written one file per minute
-
Directory structure is time-based: year/month/day/hour
-
Each minute is generated independently
-
Volume per minute fluctuates to simulate real churn
A simplified excerpt from the generator shows the idea:
This produces realistic “breathing” in the data without introducing pathological randomness.
OpenSearch Used Correctly
OpenSearch is not the star of this system. It is a supporting component.
Its role is to store and query a small, well-bounded set of derived documents:
-
~60 documents per hour
-
~1,440 documents per day
-
~43,200 documents per month
At that scale, OpenSearch is fast, cheap, and stable. There are no hot shards, no runaway mappings, and no billion-document indices slowly eating the cluster.
Trying to index every CGNAT log line would invert this relationship. The system would spend most of its time managing the index instead of understanding the data.
Search engines are excellent at searching. They are terrible at being dumping grounds for exhaust.
When Deep Search Is Needed
Deep search is still possible and still important. It just lives elsewhere.
When an incident occurs, the operator already knows:
-
the time window
-
the NAT IP or subscriber involved
-
the approximate scope
At that point, raw compressed logs for a narrow slice can be scanned directly. That path is rare, targeted, and bounded. It does not need to be fast all the time.
Most days, no one searches raw CGNAT logs at all.
The Broader Point
This design is not about CGNAT specifically.
It is about recognizing that different questions deserve different representations:
-
Raw logs for forensics
-
Aggregated facts for operations
-
Search engines for querying facts, not exhaust
Indexing everything is easy to start and hard to sustain. Aggregation-first systems require more thought up front, but they remain cheap, fast, and understandable as scale increases.
That is the trade.
Closing
This experiment shows that tens of gigabytes of high-volume infrastructure logs can be reduced to a few hundred useful facts without losing operational visibility.
The result is not a clever trick. It is a boring system that scales, which is usually the best kind.
CGNAT just happens to be a loud example.